Maths at Home! Statistics.
Just before Lockdown, we were learning about statistics and how you could create graphs from the data (information) you collected. Mrs Dobbie set us this task. Have a look at what we found out and how we collected and displayed the data. Look at our interesting statements too!


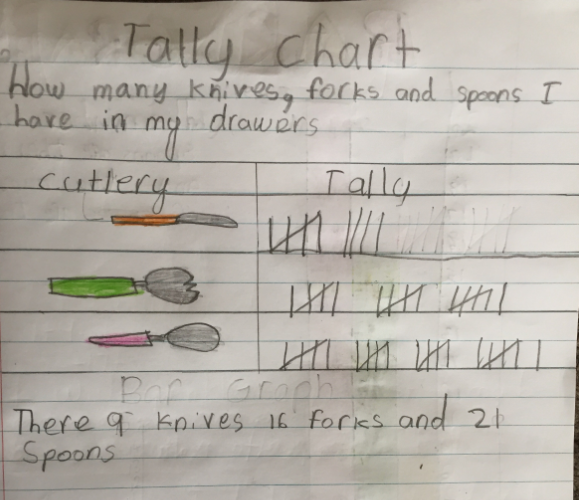

What statements could you make about any of the data contained in any one of these charts, graphs or tables?


Gosh Room 6, I may need to run a survey to find how many spoons, knives and forks I have in my cutlery draw too. You have recorded this very clearly in your data displays too.
ReplyDelete